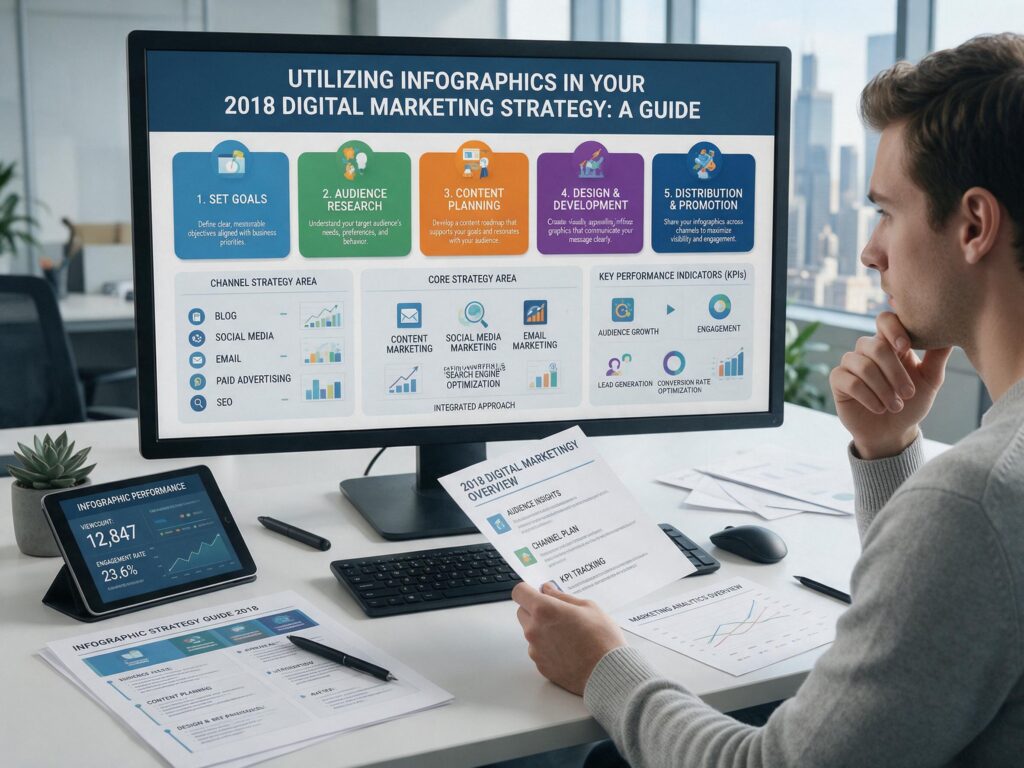
If you’re ready to refresh your brand in the new year, look no further than Denver Digital‘s infographic services. That advice was true in 2018, and it’s arguably even more true heading into 2026, now that content feeds are more crowded, attention spans are shorter, and AI generated text is flooding every channel from LinkedIn to Google’s AI Overviews. Standing out increasingly means standing out visually, and infographics remain one of the most efficient ways to do that.
Despite our focus on SEO and custom website development, we look for opportunities to create a host of original graphic and written content for your business to stand out from the crowd online. That mission hasn’t changed, but the toolkit behind it has. Infographic production once took weeks of back and forth with a designer. AI assisted design platforms have now shortened that timeline significantly. Industry benchmarks in 2026 show major improvements in production speed. Average production time reportedly dropped from about 14 hours to just over two. AI layout, copywriting, and chart generation features help modern design tools deliver infographics faster. That efficiency gain means small and mid sized businesses can now compete visually with brands that have full in house creative teams.
One digital marketing trend that’s still on the up and up is the use of infographics, namely because of their bite sized allure and simplicity when it comes to sharing across various platforms. If anything, this trend has accelerated rather than faded. Recent industry surveys put infographic adoption at roughly 65 -74% of brands overall, with enterprise organizations reaching over 80% adoption, and the vast majority of marketers say infographics are a valuable, effective part of their content mix.
It’s not about flooding the internet with content. It’s about creating high quality content that people actually read, watch, share, and engage with. In an era of AI generated content, this principle matters more than ever. Google’s AI Overviews and answer engines like Perplexity and ChatGPT Search favor useful, easy to understand content. A well labeled infographic also gives readers and AI crawlers a clear summary of your key data points. For many situations, an infographic is a perfect way to get your message across in a visual and dynamic way.
Infographics also contribute to users easily ingesting a higher amount of information, especially when they’re on social media. This isn’t just intuition. The human brain processes visual information much faster than text. Research suggests this difference may be around 60,000 times faster. Strong visuals can also increase engagement by up to 650%. Readers may also retain more information when relevant graphics support the text. This makes visual content especially effective for communicating important information.
Social media platforms are inherently spaces where multitasking is the goal and overstimulation is the result, so creating memorable visuals in the form of infographics can go a long way in helping your website or business’s content stand out and stay memorable online. That dynamic has only intensified. Short form video now competes for the attention that infographics once captured. Today’s infographics should work across multiple formats from the start. Use vertical versions for Stories and Reels covers. Create square versions for feed posts. Use wider versions for blogs and LinkedIn carousels. Infographics can also make basic content more engaging for savvy customers. Pairing a data-heavy blog post with an infographic makes complex topics easier to understand.
These graphics are perfect for learners who prefer visual facts over several lines of text. The data supports this preference. Many consumers say infographics help them retain information more effectively. Around one third of marketers also name infographics as their primary visual content format. This puts infographics ahead of many other popular visual formats. Infographics can use backlinks to guide users toward other content on your website. This remains one of their most underrated SEO benefits. Blog posts with infographics often earn more inbound links than text only posts. Infographics also appear in Google Image Search and other visual search results. This creates another discovery channel long after the original post goes live.
When done right, a good infographic can almost double traffic to a specific site or article. Current data suggests infographics can increase site traffic by up to 72%. They can also significantly boost engagement when matched with the right format and platform. These results depend on several factors, including timing, graphic quality, and content relevance. Infographics should also use descriptive alt text and nearby text summaries. Structured data can help AI search tools understand, read, and cite infographic content.
Lucky for the average person online, creating infographics can be a simple process with websites that specialize in basic graphics packages and user friendly design programs. In 2026, that landscape has expanded well beyond the drag and drop template tools of the past. Platforms like Canva AI, Visme, Piktochart, Venngage, and Infogram now let users paste in a blog post, a URL, or a spreadsheet and generate a data accurate draft infographic in minutes, with AI suggesting layout, color, and even chart type based on the underlying data. Purpose built tools like Napkin AI go a step further, turning a paragraph of written text directly into a simple visual diagram with no design experience required at all. But, your graphics can stand out with a little professional flair on behalf of our team at Denver Digital.

AI tools are excellent at producing a fast first draft, but they still tend to default to generic templates and can misread nuance in complex data, which is exactly where human strategy and design judgment continue to earn their keep. We’re not only creative but know exactly what works best when it comes to catching the average scroller’s eye, and we know how to combine AI assisted speed with brand specific design decisions that a generic template can’t replicate. Plus, once we get to know you, your business, and what you’re all about, it’s easy for us to build content that reflects you and your brand, whether that’s a single polished infographic or an ongoing visual content calendar built to support your broader SEO and AI-search visibility strategy.
FAQ
Are infographics still relevant in 2026, or have they been replaced by short form video? They’re still highly relevant. Video has grown fast, but infographics remain one of the best performing formats for static, data heavy information, and the two now work best together think of an infographic as the “shareable summary card” for a longer video or article.
Do AI infographic generators replace the need for a designer? Not entirely. AI tools like Canva AI, Piktochart, and Napkin AI are excellent for fast first drafts and can cut production time from hours to minutes, but they tend to rely on generic templates. A human designer still adds brand specific polish, accurate data interpretation, and strategic placement that AI alone often misses.
How do infographics help with SEO in the age of AI Overviews and Perplexity? Well-labeled infographics with descriptive alt text and a nearby text summary give both traditional search crawlers and AI answer engines a clear, structured data point to reference, which can improve visibility in Google’s AI Overviews, ChatGPT Search, and Perplexity results, in addition to earning traditional backlinks.
What size or format should an infographic be for social media in 2026? There’s no single answer anymore, most brands now need at least three versions of the same infographic: a tall vertical crop for Stories and Reels, a square crop for main feeds, and a wider horizontal version for blog embeds and LinkedIn.
How much does a professional infographic cost or take to produce today? Timelines have compressed significantly thanks to AI tooling, many teams now produce a first draft in under three hours versus the better part of a workday just a couple of years ago, though the cost of a fully polished, brand matched infographic still depends on complexity and whether custom illustration is involved.
Can infographics really double traffic to a page? Under the right conditions, yes. Industry data shows infographic supported pages seeing traffic increases as high as 72% compared to pages without them, though results depend heavily on timing, platform fit, and design quality.
Conclusion
If you’re ready to refresh your brand for 2026, infographics deserve a place near the top of your content strategy, not because they’re trendy, but because the data keeps backing them up. Despite our focus on SEO and custom website development, Denver Digital continues to build original graphic and written content precisely because the format keeps proving its worth: higher engagement, better information retention, more inbound links, and a growing role in how AI powered search tools surface and cite content. What’s changed since 2018 isn’t whether infographics work, it’s how fast and how well you can produce them, and how deliberately you need to design them for a landscape that now includes AI Overviews, short form video competition, and multi format social feeds.
It’s not about flooding the internet with content. It’s about creating content people will read, watch, share, and engage with. Content should also be easy for humans and AI search systems to understand. AI assisted tools now make strong first drafts more accessible than ever. However, standout brands combine speed with thoughtful design and content strategy. That’s where our team at Denver Digital comes in. We create content that fits your brand, connects with your audience, and adapts to changing search trends. If you’re ready to bring your 2026 content strategy into sharper focus, let’s talk about building an infographic or a full visual content calendar that reflects who you are and works as hard as the rest of your marketing.
This article was updated at 07.09.2026